This report provides a high-level review of global offshore wind projects in 2025. Given that the core growth momentum for the year is highly concentrated in the mainland China market, the report will focus on detailing the key developments and major advancements in the offshore wind sector within mainland China.
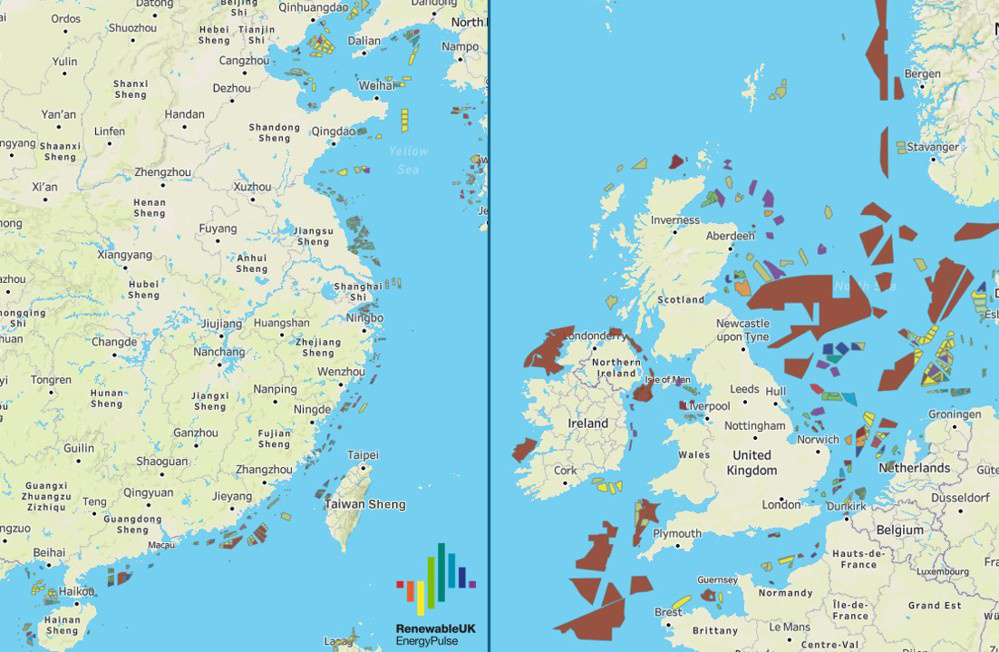
Figure 1: Layout of operational and planned wind farms in China and the North Sea, the two most active regions for offshore wind power globally. Image source: Jointly produced by EnergyPulse and Vekta Group.
I. Project Commissioning and Construction Progress
By 2025, a total of 23 offshore wind projects across six major global markets will achieve full-capacity operation, adding 8.8 GW of new installed capacity annually. The global cumulative installed capacity will rise to 89.2 GW.
Mainland China's leading position in the global market continues to expand, with 6 GW of new installed capacity added this year. Its cumulative installed capacity now accounts for 52% of the global total. This marks the fifth consecutive year that mainland China has contributed over half of the world's annual new offshore wind power capacity, solidifying its position as the world's largest offshore wind power market.
The United Kingdom ranked second with 1.3 GW of newly commissioned capacity, followed by Taiwan, China, Germany, South Korea, and France with 935 MW, 253 MW, 200 MW, and 25 MW respectively. Notably, France's 25 MW project was the only floating offshore wind project commissioned globally in 2025.
Additionally, another 2.4 GW of installed capacity projects completed all wind turbine installations by year-end but have yet to pass the final completion acceptance process.
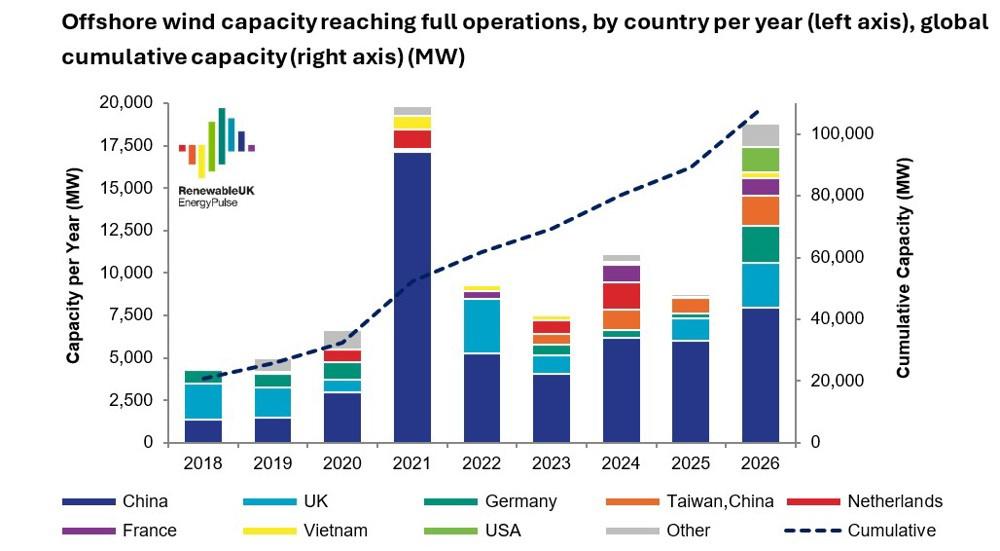
Figure 2: Annual Newly Commissioned Offshore Wind Power Capacity by Country/Region and Global Cumulative Capacity
By the end of 2025, offshore wind projects with a total installed capacity of 33GW were in full construction across 12 countries and regions worldwide. Mainland China led with 9.1GW under construction, followed by the United Kingdom and the United States with 7.6GW and 5.9GW respectively.
In the field of floating offshore wind power construction, France has a 60MW installed capacity project nearing completion. In mainland China, a 16MW floating offshore wind pilot project is currently undergoing anchoring operations. Upon completion, it will host the world's largest single-unit capacity floating wind turbine.
Globally, projects with an additional 30GW of installed capacity are advancing supporting infrastructure construction, including 18.6GW in mainland China, 3.9GW in the United Kingdom, and 3.3GW in Poland. This reserve includes approximately 263MW of floating offshore wind projects, almost entirely located in mainland China, encompassing five demonstration projects and pre-commercialization initiatives.
II. Seabed Lease Market Dynamics
2025 marked the slowest year for global seabed leasing activity in offshore wind power since 2021. Affected by multiple factors including insufficient financing feasibility for sites and reduced leasing quotas by several governments, multiple rounds of seabed leasing tenders resulted in failed bids or no bidders at all.
Despite industry headwinds, exclusive site development rights for 40GW of global offshore wind projects were secured this year, further expanding the global project pipeline. Since 2021, 21 countries and regions worldwide have released seabed leasing resources, representing a total capacity of 325GW.
Mainland China dominated the global seabed leasing market in 2025, releasing 15.1 GW of site resources across five regions in January alone, followed by an additional 5 GW release. Its cumulative leasing scale leads the world. The United Kingdom and South Korea each released 4.5 GW of seabed leasing resources, ranking in the second tier globally.
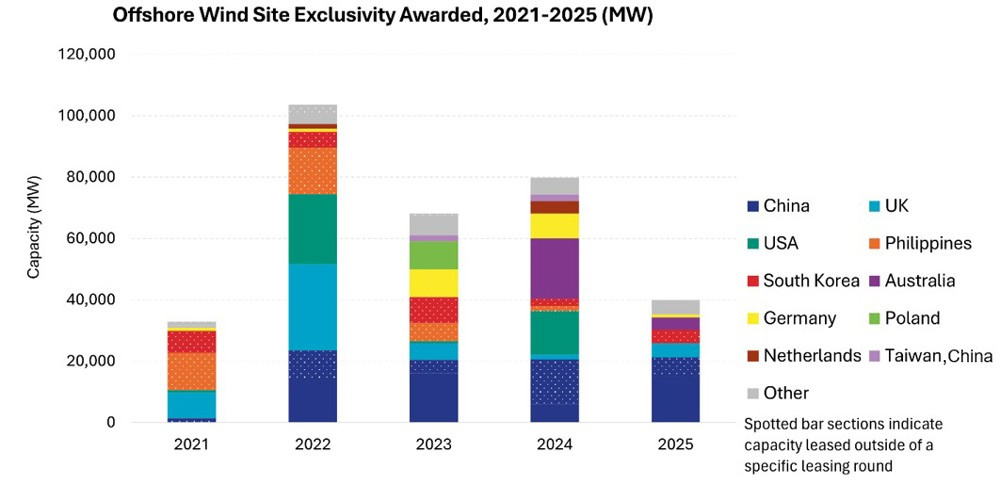
Figure 3: Global Offshore Wind Farm Seabed Lease Activities, 2021-2025
III. Status of Final Investment Decision (FID) Implementation
The global offshore wind power sector saw a positive trend in final investment decisions (FID) in 2025, with projects totaling 16.2 GW of installed capacity reaching the critical FID milestone throughout the year—a slight increase compared to 2024. This figure may still be subject to upward revision due to incomplete disclosure of FID information for projects in the mainland China market.
The scale of FID projects outside mainland China has seen significant year-on-year growth, rising from less than 5GW in 2024 to 7.6GW in 2025. Poland leads with 3.3GW, followed by Germany and the UK at 1.6GW and 1.1GW respectively. The United States, Taiwan region of China, and Vietnam account for 816MW, 500MW, and 249MW, respectively.
IV. Status of Fan Contract Signing
In 2025, the volume of formal orders for offshore wind turbines worldwide declined year-on-year, with contracted capacity for the year totaling 14.2 GW—lower than the 17.8 GW recorded in 2024. This statistic includes only formal contracts and excludes preferred supplier agreements.
Chinese turbine manufacturers secured the majority of global orders, winning contracts totaling 10.4 GW of installed capacity, all for domestic projects. Mingyang led the annual rankings with 2.7 GW in orders, followed closely by Goldwind with 2.3 GW. Siemens Gamesa and Vestas each secured approximately 1.9 GW in orders.
Total orders outside mainland China reached 3.8 GW, with Germany accounting for 2 GW, Taiwan, China at 1 GW, South Korea at 500 MW, and Poland at 390 MW. By 2025, four Chinese turbine manufacturers collectively secured formal orders for 20 MW turbines totaling 2.5 GW of installed capacity.
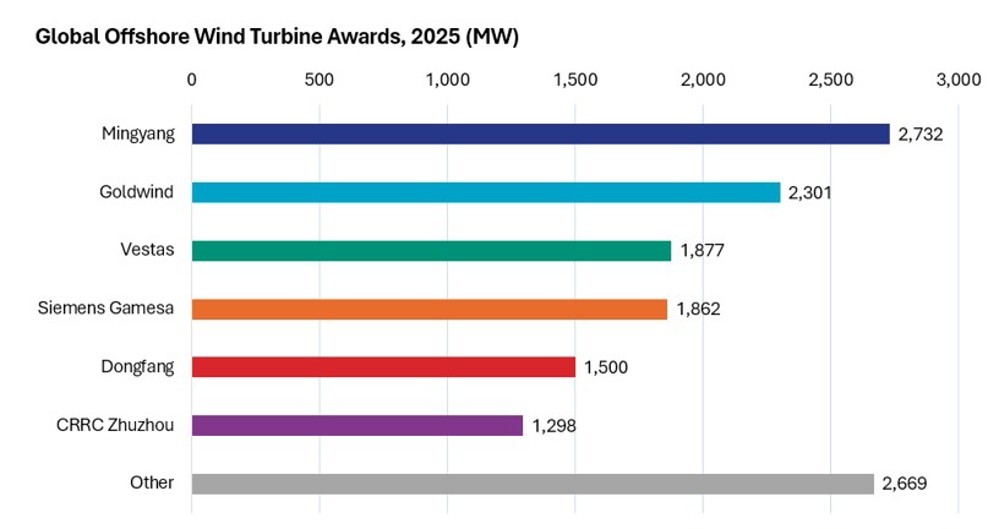
Figure 4: Formal Wind Turbine Contracts Signed by Manufacturer in 2025
At the installed capacity level, the largest single-unit wind turbines deployed in Europe by 2025 will be the 15MW models from Vestas and Siemens Gamesa. China is focusing on developing low-wind-speed sites, predominantly adopting 8-12MW turbines paired with rotors exceeding 230 meters in diameter to maximize power generation efficiency. In January 2026, Goldwind completed the installation of the world's first 20MW offshore wind turbine, with mass deployment to follow.
V. Market Development Forecast for 2026
EnergyPulse forecasts that global offshore wind capacity additions will reach 18.8 GW in 2026, excluding 10.8 GW from mainland China. This scale is expected to make 2026 the second-highest year on record since 2021 and propel global cumulative offshore wind capacity past the critical milestone of 100 GW.
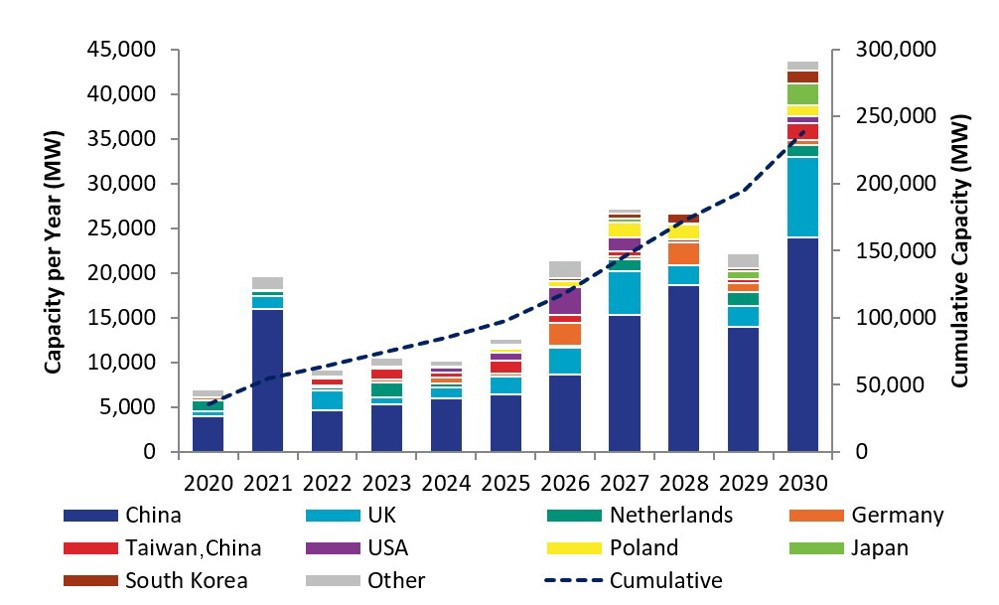
Figure 5: Forecast of Global Offshore Wind Power Capacity Commissioned from 2020 to 2030 (Unit: MW)
2026 may become a pivotal year for reshaping the global offshore wind power market landscape. Since 2021, mainland China has consistently contributed over half of the world's annual newly commissioned capacity for several consecutive years. By 2026, as the UK, Germany, Taiwan region of China, and emerging markets ramp up installations, mainland China's market share may decline slightly. However, as long as mainland China's domestic projects proceed according to the established schedule, its dominant market position will remain strong.
Global offshore wind projects maintained robust commissioning momentum in the first half of 2026: Projects totaling 2.4 GW of installed capacity have completed all turbine installations and are awaiting final acceptance inspections. Additionally, four projects each with ≥1 GW of capacity are in the final stages of turbine installation, with less than 10% of remaining work, providing solid support for capacity growth in the first half of the year.